In statistics, many time series exhibit cyclic variation known as seasonality, defined as the repetitive and predictable movement around the trend line. It is detected by measuring the quantity of interest for small time intervals, such as days, weeks, months or quarters. The best known seasonal progression is the outdoor temperature. Based on the time of the year, you probably know the range of temperatures you can expect. Let’s visualize the temperature in the Northwestern U.S. on picture below:
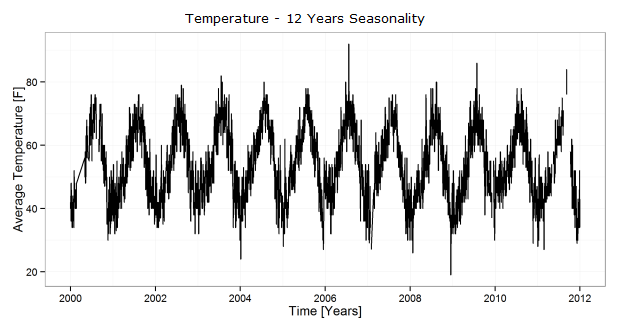
We don’t have to be statistical experts to clearly see the seasonal cyclic movement of temperature, which is very similar every year. To be able to predict temperature for the next year, it’s very useful to calculate seasonal pattern. For now, you can think about the pattern as an average temperature for a given day over all years. Temperature pattern is calculated in the next picture (red line is the pattern, black lines are the individual years charted on the same X axis):
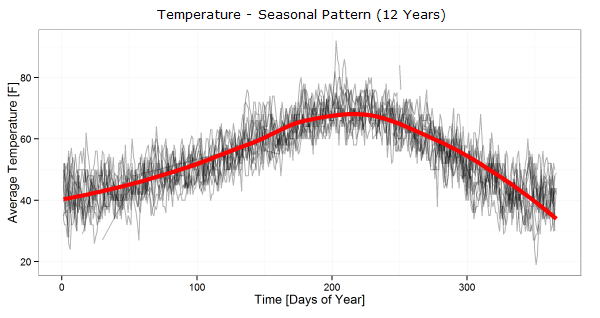
Now imagine instead of temperature some commodity price. That would be an excellent trade, wouldn’t it? Buy in February, close and reverse position around the end of July and close at the end of the year. And repeat that every year. Unfortunately we can’t trade temperature that way.
But the prices of goods are subject to seasonal tendencies as a result of natural processes, for example harvest (supplies of grain peak at harvest and drop off through the year) or weather periods occurring at various times of the year (oil is less expensive in summer than in winter during the heating season). And we have other important annual events, which can create yearly cycles in supply and demand. For example, the U.S. income taxes due date April 15th, dividend payments on certain dates, end of the fiscal year and maybe something more exotic like a mood improvement prior to holidays.
Let’s see some nice seasonality examples in commodities in the next section.
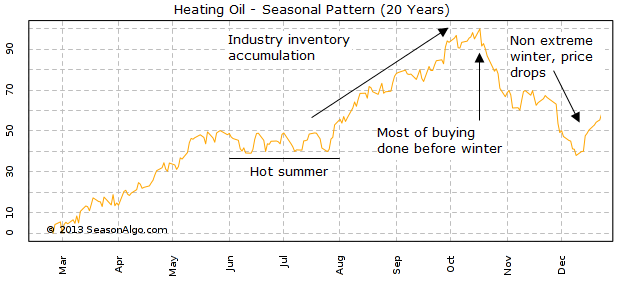
Most of the commodity prices are influenced by supply. Heating oil is exception as prices are exposed to demand forces more than supply. Heating oil has a seasonal trend to move higher from July (often the hottest month in the year, the demand is low) into October. This is mainly caused by refiners building their inventories and the commercial buyers making their purchases. Increasing demand pushes prices higher. Usually people believe that heating oil makes seasonal highs during the winter, but this is usually not the case. Most of the buying for heating oil is done before the beginning of the winter. Refineries with full inventories are prepared to meet demand and market starts to deal with distribution into the retail market which means liquidation and price drop.
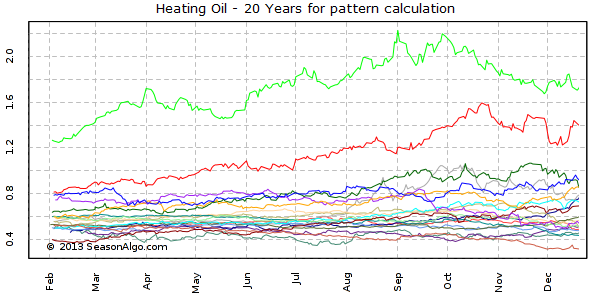
But sometimes we can be surprised by external factors which can impact on the heating oil market and cause counter seasonal trends. With extremely long cold winter, the demand for heating oil can increase together with prices. You can see all of these tendencies on 20 years pattern shown in the picture:
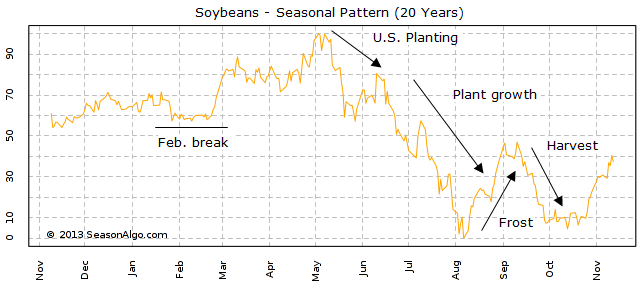
Agricultural prices move when anticipating change and adjust when that change is realized. When these changes are annual in nature, a recurring cycle of anticipation-realization evolves. These known cyclic patterns driven by known fundamentals can inspire confidence. The soybean market is dominated by two major producers: Brazil and the the United States. Soybeans are harvested in November-December in the the U.S., while the Brazil ian harvest takes place in May-June. The most reliable cycle in soybean prices is the one-year seasonal cycle. Prices develop sideways to lower into the "February Break" as the U.S. producers market their recent harvest and Brazil's crop rapidly develops. Beans usually make a seasonal low at harvest time during October or November. September shows rally as concerns about early frost (which can damage the crop) can arise. Another important characteristic of the soybean seasonal cycle is a high during April, May, June, or July. The timing of the seasonal low is usually more consistent than the timing of the seasonal high.
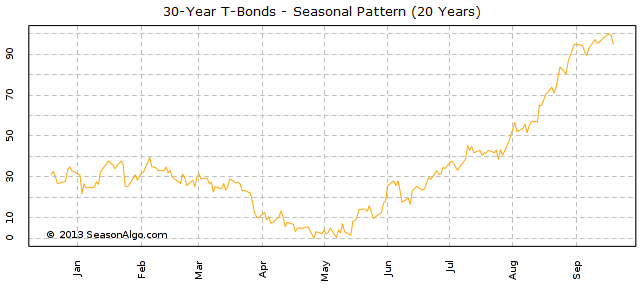
Treasury Bonds often hold seasonal correlation opposite to the equity markets and can be used to place money when stocks are negative. Picture below shows the seasonal pattern of bond investment. We can see weakness from the beginning of the year followed by rally in the rest of the year. So if you want to buy bonds, May is obvious choice.
Now we know what the seasonality is and we saw some examples of fundamental conditions behind it. But there are dozens of markets to trade and fundamental analysis can be very difficult for common retail trader (not every seasonality is as clear as for Heating Oil). Remember, this is area of the other players – commercial hedgers which use markets for their business, not for speculation. And you can never hope to have information as available as they do and be able to understand and cover in necessary detail all the markets. But we know that fundamentals and seasonal tendencies are already included in the price and work with that.
Having enough of historical data, good knowledge of math and statistics, we can try to construct our own seasonal patterns derived from previous years. In the good old days, before the dawn of computers and their application in trading, it was quite difficult to create seasonal patterns. Usually, only monthly or maybe weekly high and low prices were used for seasonal calculations and we knew for example that soybeans in October made in 68% seasonal low and trade that. But nowadays, with an easy access to a market data and computing power, we can derive seasonal pattern from daily data with any historical depth.
How to calculate seasonal pattern? To cut a long story short, first we need to take all years we use for calculation, as can be seen on picture below (Heating Oil – 20 Years):
Then we have to consider extremes. We are interested in seasonal tendencies, not in absolute values, and over the time some prices can have a very wide range. That’s why normalization is used, to make sure that extremes will not influence our pattern. You can think about normalization as recalculation of prices of each year to percentual 0-100% scale (take the low as 0%, the high as 100% and adjust all data accordingly). The final step is to take normalized price for all years and calculate average. You can see resulting patterns in previous example charts.
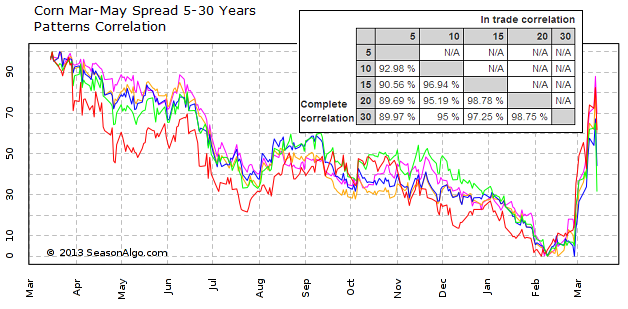
Of course, there can be a question, how many years we should use for calculation. Ten, fifteen, twenty or whole available history? Usually fifteen is a good compromise, but it is also very useful to include less and more years patterns, such as five and twenty years, to see the changing tendencies in history. For example, when Brazil became major soybeans producer, seasonal pattern changed almost upside down. Or, the other reasons can be the technical advancement in agriculture, improvement in storage techniques, changes in geopolitics and so on. And stability of the seasonal trends is something what is good to be aware of. Next picture shows Corn spread (we will cover spreads in another article) five to thirty years patterns correlations, which are almost 90 to 99%.
There are several ways how to use seasonality in trading. You can use it as an additional component in your discretionary or automated trading system. Seasonal factor can be included with according weight in calculation to obtain trading decision. The weighting depends on the market, seasonal pattern and importance of any other remaining parameters. Another technique can be using seasonality as a filter. Never open position against seasonal trend. Such a simple rule can increase your profit probability.
But here at SeasonAlgo, we are focusing on seasonality as the main object to trade. Our database contains thousands of seasonal strategies for each month. Although we have strategies for outright (naked) futures, the best strategies are for futures spreads. Why? Trading spreads has many advantages, but speaking now about seasonality, these seasonal trends are much stronger and reliable. We can use not only seasonality of underlying commodity, but also relations between different futures contract months. For example, due to harvest pressure and the trading of two different crops at the same time, the tendency for some contract months to rise or fall faster than other months can result in nice spread opportunities.
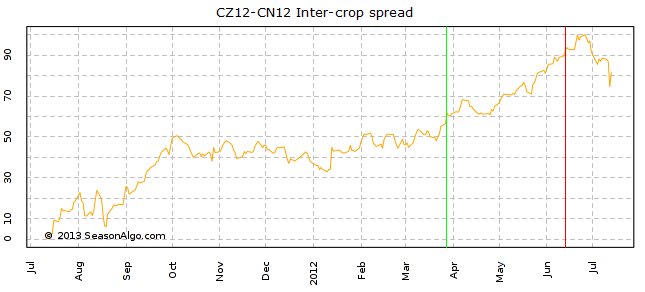
The picture below shows classic bullish corn spread. Long December contract represents new crop, short July old crop. During the most extreme conditions, such as bad weather or tight supply, old-crop can rise over new-crop. But this happens very rarely. Usual conditions are represented by seasonal pattern when the market inclines to favor new-crop over old-crop after the beginning of planting. Computer generated strategy with seasonal window for year 2012 is entering on March 28 and exit on Jun 13. This strategy has win probability 90% (18 from 20 years closed with profit).
We should not trade them blindly and rely only on seasonal pattern and computed best entry/exit window. You can expect extreme years and counter-seasonal movements from time to time to come, so it’s always necessary to apply stop loss and proper money management. It’s also useful to use basic technical analysis to get a bigger picture about the current situation. What is the position of current year compared to previous years? Is there a space to run for nice profit and some support/resistance area to place stop loss? Seasonal movements are not precise, they can occur earlier or later, and technical analysis can helps us with timing of entry and exit.
The information presented in this site is for general information purposes only. Although every effort attempt has been made to assure accuracy, we assume no responsibility for errors or omissions. Everything is provided for illustrative purposes only and should not be construed as investment advice or strategy. This site disclaims any responsibility for losses incurred for market positions taken by visitors or registered users, or for any misunderstanding on the part of any users of this website. This site shall not be liable for any indirect incidental, special or consequential damages, and in no event will this site be held liable for any of the products or services offered through this website.
The risk of loss in trading commodities can be substantial. You should therefore carefully consider whether such trading is suitable for you in light of your financial condition. The high degree of leverage that is often obtainable in commodity trading can work against you as well for you. The use of leverage can lead to large losses as well as gains. Past results are not indicative of future results. Hypothetical performance results have many inherent limitations, some of which are described below. No representation is being made that any account will or is likely to achieve profits or losses similar to those shown. In fact, there are sharp differences between hypothetical performance results and the actual results subsequently achieved by any particular trading program. One of the limitations of hypothetical performance results is that they are generally prepared with the benefit of hindsight.
© 2013, SeasonAlgo.com