Futures markets are based on individual contract. Every contract has its own life cycle. At every moment, there are certain number of contracts, which are active and have expiration dates somewhere in the future. When one contract expires, new contract is added for trading and this cycle repeats. So every contract has its own limited history of data. If we want to have a long-term continuous history, we need to join data of different contracts together. This is different for example to stocks which offer a continuous stream of prices (usually since start of trading).
There is no single correct algorithm to calculate a continuous contract. It depends on trader's needs which algorithm should be chosen. The simplest and the most common method is spot (front) month continuous which takes always the nearest expiration contract and moves to the next one after expiration (contracts rolling).
Chart below shows example of spot month continuous split data.
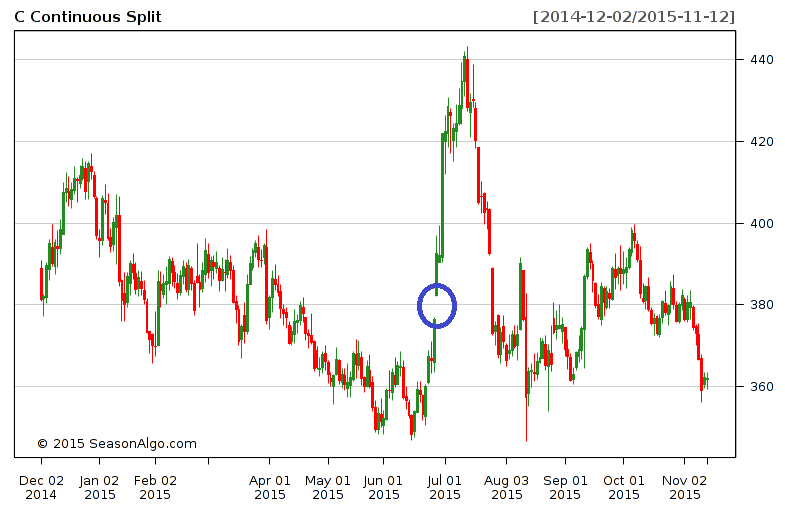
There are many factors which can generate a difference in the price of different expiration contracts (for example contango, backwardation, crop seasons, etc.). It can result in gap between the old contract and the new contract price. These gaps can be significant and data can appear disjointed (blue circle on the chart above shows gap when two contracts are joined).
How to eliminate gaps? When rolling contracts backwards, we can measure every roll gap and adjust all previous prices up or down based on gap direction.
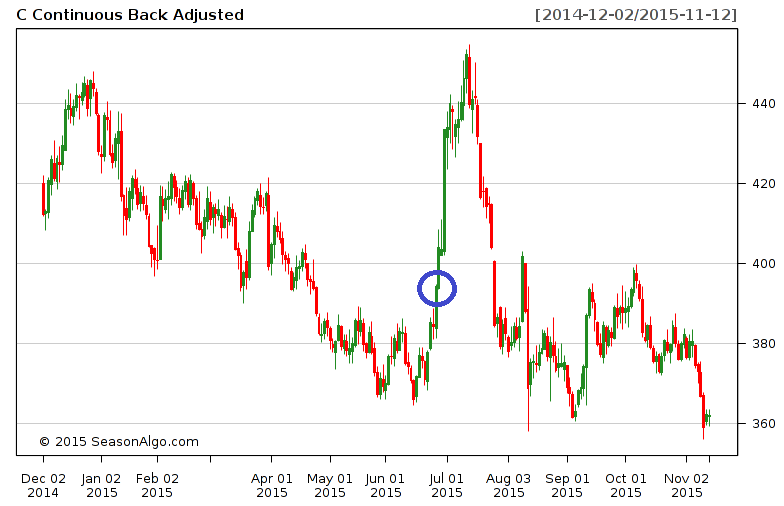
Chart below shows example of spot month continuous back adjusted data (blue circle shows gap between two contracts eliminated).
There are more ways how roll and adjust data. Instead of expiration, we can follow the market and roll contracts based on volume or open interest. To eliminated gaps, we can instead of back adjust data use opposite direction and forward adjust data. Some data vendors can have their own proprietary algorithms for continuous data calculations. But this is out of the scope of this article. Let's now compare our two basics methods.
The split contract shows where futures prices have traded in the past. It gives you bigger picture and a good overview of whether current futures prices are trading high or low compared to the history. Split data show price levels in a futures market. As a disadvantage, they show you fake price movements (roll price gaps) which can affect indicator calculations (for example moving average) and automated trading systems - ATS (gaps will be calculated in profit/loss). Back Adjusted data show correct price movements, so they can be used for indicators and ATS. As a disadvantage, they show fake price levels (prices which were never traded in the history).
If you are that type of trader who analyzes outright futures legs (usually what's front leg is doing), then you will find continuous data for outright futures in our Analyze => Futures section. If you use COT indicators, you can now with continuous data examine whole COT history.
Seasonal analysis and trading has its own requirements for continuous data construction. When studying seasonality we are interested in specific period which repeats every year. We roll contracts (outright futures or spread) with same expiration months and change only year.
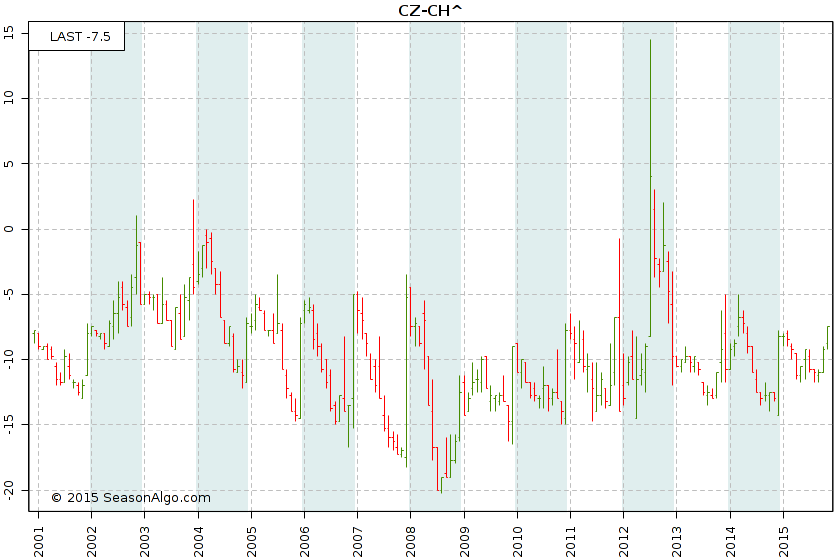
Chart below shows continuation data with yearly roll for CZ-CH^ spread (^ means front leg year +1). Spread used for data construction are CZ15-CH16, CZ14-CH15, CZ13-CH14 etc. Grey/white bars serve as spreads separator for better visualization. You will find this chart in our Analyze => Continuation section. Chart uses weekly/monthly aggregation so OHLC data can be displayed.
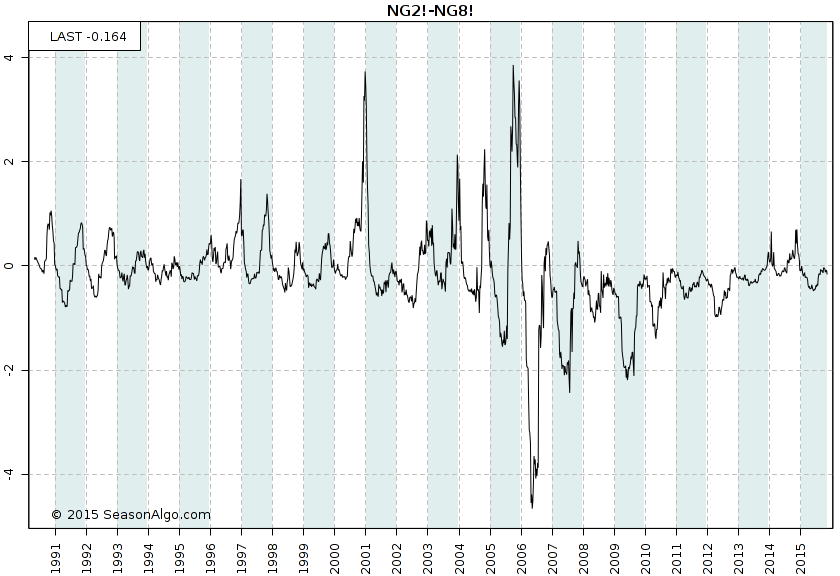
Another useful continuation data construction for seasonal and spread trading is roll which preserves term structure. Basic principle is same as with simple continuation split roll, but we don't necessary roll nearest expiration contract and we keep specific distance. For example NG2! means rolling the second nearest expiration months. NG8! rolls the eighth expiration contract. We can of course combine data to spread for example NG2!-NG8!. Let's say current month is November and the spot contract is NGX15. Then term structure roll uses NGF16-NGN16, NGZ15-NGM16, NGX15-NGK16 etc spread. When NGX15 expires, then current spread will be NGG16-NGQ16. What is the advantage of such continuous data construction? It can nicely show seasonal tendencies, check chart below. You will find this chart in Analyze => Continuation section and just change data type.
For both types of roll, it's important to see real price levels, so it's simple split without gaps adjustment.
The information presented in this site is for general information purposes only. Although every effort attempt has been made to assure accuracy, we assume no responsibility for errors or omissions. Everything is provided for illustrative purposes only and should not be construed as investment advice or strategy. This site disclaims any responsibility for losses incurred for market positions taken by visitors or registered users, or for any misunderstanding on the part of any users of this website. This site shall not be liable for any indirect incidental, special or consequential damages, and in no event will this site be held liable for any of the products or services offered through this website.
The risk of loss in trading commodities can be substantial. You should therefore carefully consider whether such trading is suitable for you in light of your financial condition. The high degree of leverage that is often obtainable in commodity trading can work against you as well for you. The use of leverage can lead to large losses as well as gains. Past results are not indicative of future results. Hypothetical performance results have many inherent limitations, some of which are described below. No representation is being made that any account will or is likely to achieve profits or losses similar to those shown. In fact, there are sharp differences between hypothetical performance results and the actual results subsequently achieved by any particular trading program. One of the limitations of hypothetical performance results is that they are generally prepared with the benefit of hindsight.
© 2013, SeasonAlgo.com