The Commitments of Traders (COT) reports can sometimes give us a good idea of future significant moves in the market. Every Friday the Commodity Futures Trading Commission (CFTC) releases the COT Report which aggregates all the futures positions of every major player in the futures markets.
The legacy COT report separates reportable traders into commercial and non-commercial categories which can be turned into three groups:
Commercial Hedgers - The largest positions are usually held by commercial institutions or hedgers who are interested in taking delivery of the underlying commodity. Commercials are considered the most knowledgeable and are the most important group.
Large Traders - The next largest group are typically hedge funds, banks and Commodity Trading Advisors (CTA). On average they do not have the intent on taking delivery and are trading purely for profit.
Small Speculators - This group of traders is generally thought to be small speculators, hedgers and retail traders who are not holding a position large enough to report to the CFTC. Sometimes also are called dumb money. Typically this group is the most ill-informed.
Reports can be downloaded from CFTC, example of such a report is shown on the picture below.
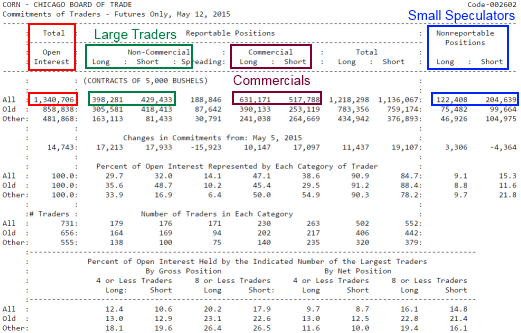
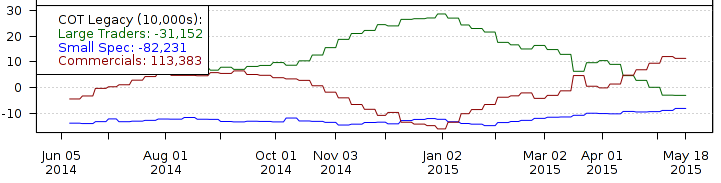
Reading the report can give us some insight into positions of traders, but the real advantage is monitoring how these positions change over time. Just to know that for example Commercials are some number of contracts long, doesn’t tell us anything, you need to find out if they are adding more to their positions or they are starting to reduce contracts over time. To make the COT data useful, we need to store data, so we can plot charts and see how positions are changing over time. The picture below shows COT Legacy data plotted as net positions (long-short positions) in the chart.
The changes in major trader positions - Commercials and Large Traders are important because they drive trends. Commercials are often in the opposite direction of the markets trends. They are actively buying when the market is declining and actively selling when the market is rising. They are the experts in their businesses and often are acting many months in advance of where they expect the price to be. Commercials are the ones that really move the markets and start the trends, Large Traders typically trade trend following systems with volume (the trends only being initiated by Commercials). Large Traders usually don't enter all at once and they pyramid their positions. Small Traders are wrong most of the time (80-90% retail traders failure rates) and their net position is usually vulnerable to either long liquidation or short-covering if the market starts to move against them.
The price moves are correlated with what Commercials (negatively) and Large Traders (positively) do, so monitoring their positions can act as a confirmation for trade signals given by the price action. Picture below shows correlation between the price and major traders positions.
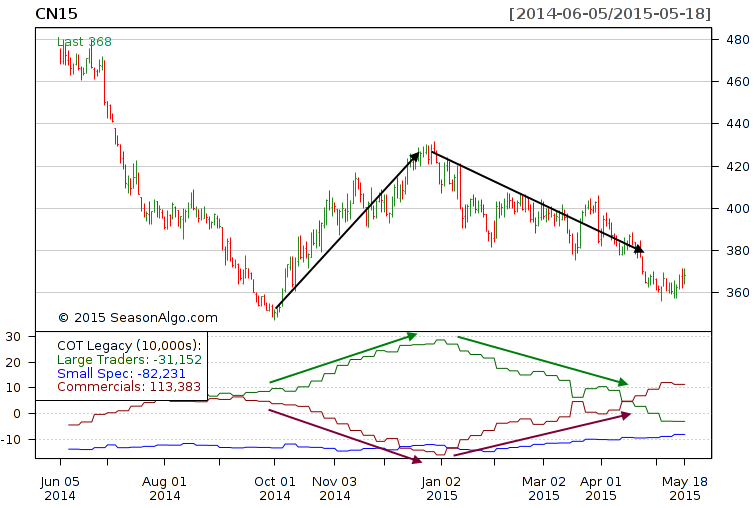
Typical bull setup can be when Large Traders are net long and Small Speculators are net short. You should be warned when trend in Large Traders position is going down and the funds are starting to liquidate their net long position. Bear setup exists when Large Traders are holding a net short position and Small Speculators net long position.
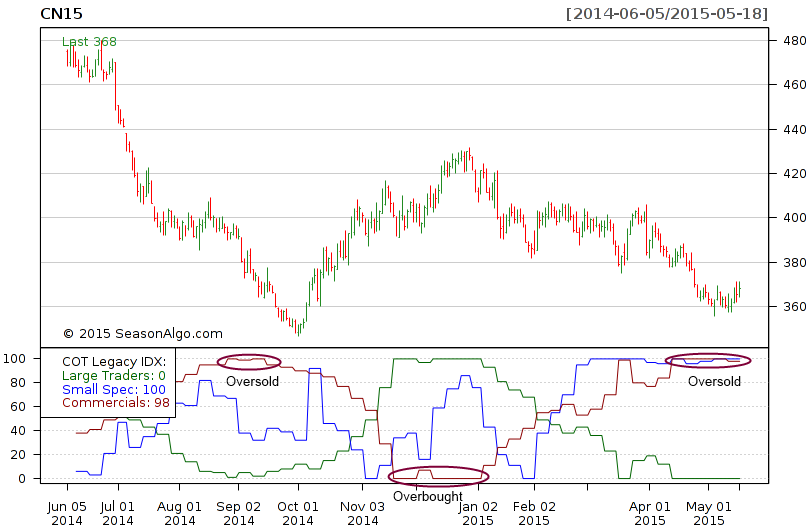
Another way how to make use of COT data is to build indicator called the COT Index. Indicator formula is simple:
COT Index = (current value – minimal value) / (maximal value – minimal value) * 100
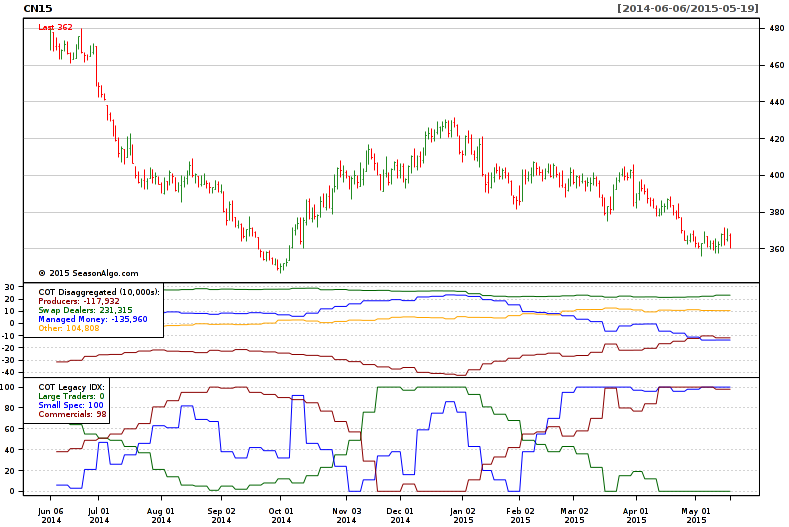
Indicator normalizes net positions to a 0% - 100% scale. It reflects where the current net positions rank as a percentage of its range over the recent past data. Indicator can be used to watch for extremes and shows when the biggest most influential players are all in either buying or selling. COT Index signals can’t be trader alone, but can be used as additional component and confirmation to a trading system. Picture below shows overbought and oversold market based on COT Index from Commercials with 26 weeks period.
Available only on major physical commodity markets, increases transparency from the legacy COT report. Three new disaggregations that have been available in recent times further split up Commercials and Large Traders groups into more specific groups:
Commercials - Producer/Merchant/Processor/User - Group that predominantly engages in the production, processing, packing or handling of a physical commodity and uses the futures markets to manage or hedge risks.
Commercials - Swap Dealers - Group that deals primarily in swaps for a commodity and uses the futures markets to manage or hedge the risk associated with those swaps transactions. The swap dealer's counter parties may be speculative traders (e.g. Hedge Funds) or traditional Commercials.
Non-Commercial - Managed Money - Registered Commodity Trading Advisors (CTAs), Commodity Pool Operators (CPOs) or an unregistered fund identified by CFTC. These traders are engaged in managing futures trading on behalf of their clients.
Non-Commercial - Other Reportables - Every other reportable trader that is not placed into one of the other three groups.
Picture below shows legacy and disaggregated data.
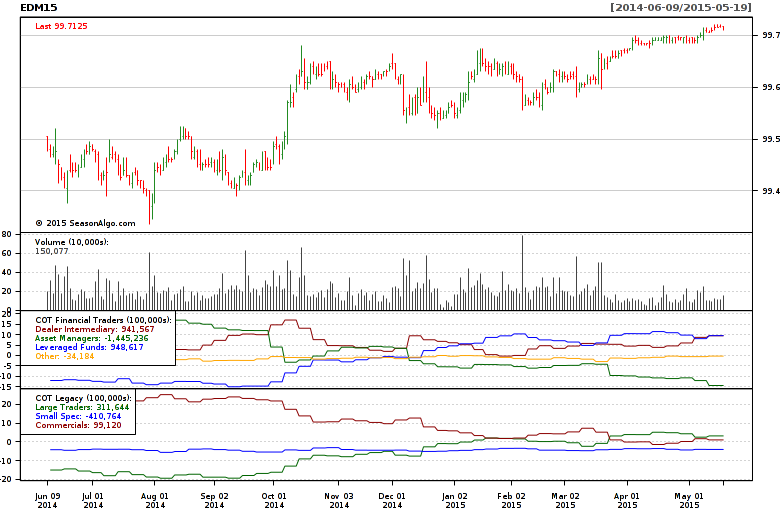
Divides the financial futures market participants into the sell side and buy side. This functional division of participants focuses on their respective roles in the broader marketplace:
Dealer/Intermediary - Typically described as the sell side of the market. Earn commissions on selling financial products, capturing bid/offer spreads and otherwise accommodating clients. Though they may not predominately sell futures, they do design and sell various financial assets to clients. Futures contracts are part of the pricing and balancing of risk associated with products they sell. These include large banks and dealers in securities, swaps and other derivatives.
Asset Manager/Institutional - Institutional investors, including pension funds, insurance companies, mutual funds and portfolio/investment managers whose clients are predominantly institutional.
Leveraged Funds - Typically hedge funds and various types of money managers, including registered Commodity Trading Advisors (CTAs), Commodity Pool Operators (CPOs) or an unregistered funds identified by CFTC. These traders may be engaged in managing and conducting proprietary futures trading and trading on behalf of speculative clients.
Other Reportables - Reportable traders that are not placed into one of the first three groups. Mostly are using markets to hedge business risk (related to foreign exchange, equities or interest rates). Includes corporate treasuries, central banks, smaller banks, mortgage originators, credit unions and any other reportable traders.
Picture below shows legacy and financial traders data.
The main drawback is that data are always late and lagging. It’s not a real-time report showing current positions. Between when data are collected and when the report is published, large changes in positioning could have already occurred. Commercials and Large Traders can and do quickly change positions. Traders should rather watch for trends in positioning, instead of just using single weekly number.
Markets can stay overbought and oversold for very long periods of time. COT Index extreme alone doesn’t necessarily mean that the market will reverse. Big players have to commit to a new direction of accumulation or distribution to have new trend change started. Correlations between price direction and Commercials and Large Traders can break for periods of time, making the data harder to trade.
The COT is a great tool for traders. It shows positions of big players (Commercials and Large traders) in the market. Positions changes over time are important and can help to spot reversals and to confirm new trends. COT data should be used as additional confirmation tool, seasonality and price action should always be the primary inputs.
Indicators can be calculated from all three COT data sets:
The information presented in this site is for general information purposes only. Although every effort attempt has been made to assure accuracy, we assume no responsibility for errors or omissions. Everything is provided for illustrative purposes only and should not be construed as investment advice or strategy. This site disclaims any responsibility for losses incurred for market positions taken by visitors or registered users, or for any misunderstanding on the part of any users of this website. This site shall not be liable for any indirect incidental, special or consequential damages, and in no event will this site be held liable for any of the products or services offered through this website.
The risk of loss in trading commodities can be substantial. You should therefore carefully consider whether such trading is suitable for you in light of your financial condition. The high degree of leverage that is often obtainable in commodity trading can work against you as well for you. The use of leverage can lead to large losses as well as gains. Past results are not indicative of future results. Hypothetical performance results have many inherent limitations, some of which are described below. No representation is being made that any account will or is likely to achieve profits or losses similar to those shown. In fact, there are sharp differences between hypothetical performance results and the actual results subsequently achieved by any particular trading program. One of the limitations of hypothetical performance results is that they are generally prepared with the benefit of hindsight.
© 2013, SeasonAlgo.com