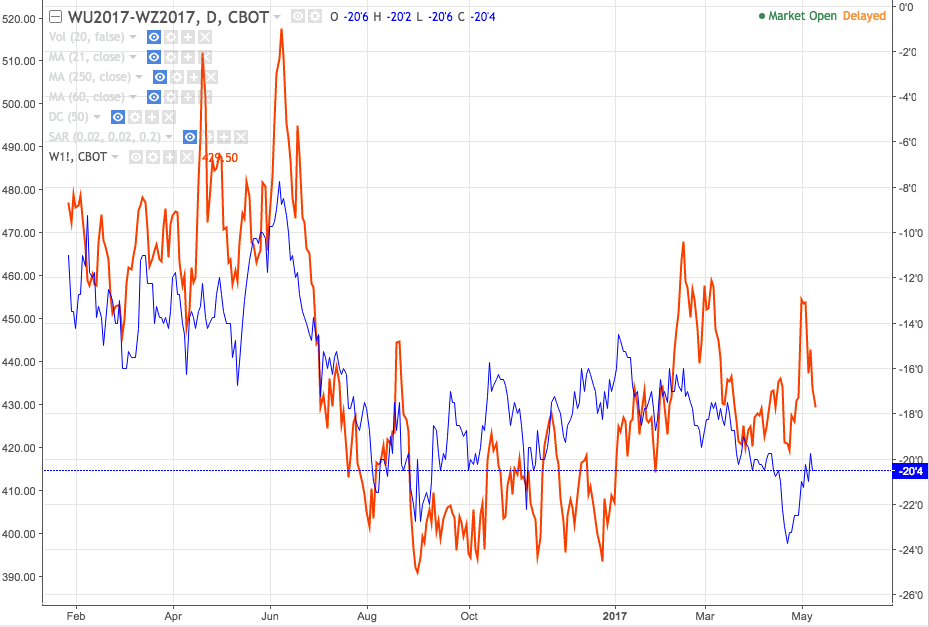
 Figure 1 Red: Wheat rolling nearby contract; Blue - Sep-Dec futures spread, source: Tradingview.com
With the snowy weekend during the last week of April, the concerns of potential wheat crop damage increased significantly at the beginning of May. However, the market seems to have discounted the damage already and fell back to pre-damaged levels (see chart above, red = First generic wheat contract, blue = wheat Sep-Dec spread 2017).
It is important to note that the fully carry spread for the Sep-Dec spread equals approximately -20 cents. This implies that every time the spread between the Sep-Dec contracts falls below the carry, it is possible to make use of physical arbitrage for the large corporates involved in the grain industry. Therefore, levels below the so-called "full carry spread" are not sustainable over time and create a floor for the spread.
Historically, the full carry spread is rarely reached and the spread stays around 80% of the full carry spread (the CME even introduced variable storage rates, which increase whenever 80% of the fully carry spread is reached). This provides spread traders with high probability entry levels because the possible risk if the first generic future falls for some reason is limited and, most importantly, "known". In contrast, if one buys the outright future the possible loss is difficult to estimate and can fluctuate significantly over time. The wheat rally at the end of April / beginning of July represents a good example for this strategy. If one would expect the price of futures to rise, one could have bought the spread when it was trading at lows of -23 cents around the fully carry spread and sold after the rally at the beginning of May, which would have represented a high probability, high reward:risk trade, as opposed to just buying the outright future. Buying the outright future would have implied 100% dependency on how the market digests the news about the damaged wheat crop combined with potential unlimited or unknown risk.
What is more, futures spreads are usually less volatile than their outright counterparts. They tend to trend easier and therefore are easier to trade on a psychological basis as well. While the outright future has given up all the gains since the beginning of May, the Sep-Dec spread is still trading at post wheat-damage levels.
In case someone does not exactly know what the level of the full carry spread is or how to calculate it. It is still a good approximation to just look at historical charts. One can easily see that the minimum levels that futures spreads reach are roughly the same every year for obvious reasons (storage costs and rates don't quadruple without a very good reason). In some years the spread does not even reach a negative number, which was usually due to the fact that prices were rallying and the futures curve was in backwardation. Lastly, I would like to mention that the volatility of futures spreads in agricultural commodities is all on the upside because potential causes of supply shortage can let the front month contract explode upwards. As a result, these spreads are one of the best ways one can structure a cheap long realised volatility play in the commodities market. Shorts have to be careful because this mechanism would work against them if they short a futures spread.
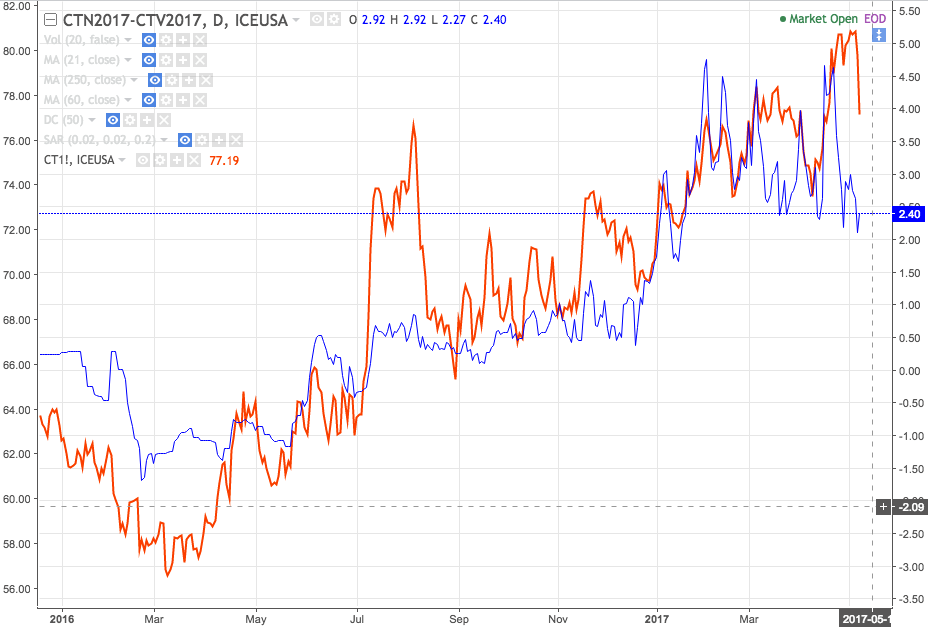 Figure 2 Red: Rolling nearby cotton contract; Blue: July-Oct futures spread, source: Tradingview.com
For those interested in how to calculate full carry spreads I would recommend to go to the website of St. Louis FED and get the bank prime loan rate, which is currently at 4%.
At the CME group website it is possible to get the premium charges of all agricultural commodities in the CBOT rulebook for the according commodity. For wheat, according to CME rulebook, the premium charges are 16.5/100's of one cent per bushel per day.
With this we can approximate the full carry spread = 16.5/100 * 30 (assuming 30 days per month) = 4.95 cents per bushel per month + $4.30 (current price of the nearby futures contract x 0.04/12 = 1.43 cents => 4.95 + 1.43 = 6.38 cents per bushel per month is our approximated full carry spread. For three months it would equal about 19 cents. I use the word approximately because the large corporations are usually able to get a discount for size and therefore might have slightly different interest rates and storage costs. However, this calculation combined with historical spread charts can give you a very good idea of where the full carry spread is.
Thanks for reading,
Christian
The information presented in this site is for general information purposes only. Although every effort attempt has been made to assure accuracy, we assume no responsibility for errors or omissions. Everything is provided for illustrative purposes only and should not be construed as investment advice or strategy. This site disclaims any responsibility for losses incurred for market positions taken by visitors or registered users, or for any misunderstanding on the part of any users of this website. This site shall not be liable for any indirect incidental, special or consequential damages, and in no event will this site be held liable for any of the products or services offered through this website.
The risk of loss in trading commodities can be substantial. You should therefore carefully consider whether such trading is suitable for you in light of your financial condition. The high degree of leverage that is often obtainable in commodity trading can work against you as well for you. The use of leverage can lead to large losses as well as gains. Past results are not indicative of future results. Hypothetical performance results have many inherent limitations, some of which are described below. No representation is being made that any account will or is likely to achieve profits or losses similar to those shown. In fact, there are sharp differences between hypothetical performance results and the actual results subsequently achieved by any particular trading program. One of the limitations of hypothetical performance results is that they are generally prepared with the benefit of hindsight.
© 2013, SeasonAlgo.com